Welcome to 290 Morton Street! This charming 3-bedroom, 2-full-bath ranch offers comfortable one-level living with plenty of additional space and possibilities. Step inside to find a functional floor plan featuring a welcoming living area, kitchen, three well-sized bedrooms, and hardwood flooring throughout portions of the home.A full basement provides excellent additional space for storage, recreation, a home office, workshop, or future finishing possibilities. The home also features a fireplace, convenient breezeway/mudroom, and an attached 1-car garage offering plenty of room for vehicles, tools, and equipment. Conveniently located near area schools, parks, shopping, highway access, and other local amenities. Whether you're looking for your first home, downsizing to single-level living, or searching for a property with room to make your own, 290 Morton Street is ready for its next owner. Schedule your showing today!
For sale
$335,000
290 Morton St, West Springfield, MA 01089
3beds
1,230sqft
Single Family Residence
Built in 1965
0.28 Acres Lot
$342,100 Zestimate®
$272/sqft
$-- HOA
What's special
Comfortable one-level livingThree well-sized bedroomsFunctional floor plan
- 16 days
- 1,611
- 59
Likely to sell faster than
Zillow last checked:
Listing updated:
Listed by:
Robert Spano 413-627-2352,
Naples Realty Group 413-650-1314
Source: MLS PIN,MLS#: 73587538
Facts & features
Interior
Bedrooms & bathrooms
- Bedrooms: 3
- Bathrooms: 2
- Full bathrooms: 2
Living room
- Level: First
Heating
- Oil
Cooling
- Window Unit(s)
Appliances
- Included: Water Heater
Features
- Basement: Full
- Number of fireplaces: 1
Interior area
- Total structure area: 1,230
- Total interior livable area: 1,230 sqft
- Finished area above ground: 1,230
Property
Parking
- Total spaces: 4
- Parking features: Attached, Paved Drive
- Attached garage spaces: 2
- Uncovered spaces: 2
Lot
- Size: 0.28 Acres
Details
- Parcel number: WSPRM00380B35500L00093,2660965
- Zoning: A-2
Construction
Type & style
- Home type: SingleFamily
- Architectural style: Ranch
- Property subtype: Single Family Residence
- Attached to another structure: Yes
Materials
- Foundation: Concrete Perimeter
Condition
- Year built: 1965
Utilities & green energy
- Sewer: Public Sewer
- Water: Public
Community & HOA
Community
- Features: Park, Highway Access, Public School
HOA
- Has HOA: No
Location
- Region: West Springfield
Financial & listing details
- Price per square foot: $272/sqft
- Tax assessed value: $276,500
- Annual tax amount: $4,112
- Date on market: 10/7/2026
Estimated market value
$342,100
$325,000 - $359,000
$2,623/mo
Price history
| Date | Event | Price |
|---|---|---|
| 10/7/2026 | Listed for sale | $335,000+42.6%$272/sqft |
Source: MLS PIN #73587538 Report a problem | ||
| 11/15/2021 | Sold | $235,000+62.1%$191/sqft |
Source: MLS PIN #72874443 Report a problem | ||
| 4/17/2018 | Sold | $145,000-16.2%$118/sqft |
Source: Public Record Report a problem | ||
| 3/23/2018 | Pending sale | $173,000$141/sqft |
Source: CENTURY 21 Hometown Associates #72159230 Report a problem | ||
| 2/14/2018 | Price change | $173,000-2.8%$141/sqft |
Source: CENTURY 21 Hometown Associates #72159230 Report a problem | ||
| 8/26/2017 | Price change | $178,000-7.8%$145/sqft |
Source: CENTURY 21 Hometown Associates #72159230 Report a problem | ||
| 7/10/2017 | Price change | $193,000-7.2%$157/sqft |
Source: CENTURY 21 Hometown Associates #72159230 Report a problem | ||
| 5/5/2017 | Listed for sale | $208,000$169/sqft |
Source: Century 21 Hometown Associates #72159230 Report a problem | ||
Public tax history
| Year | Property taxes | Tax assessment |
|---|---|---|
| 2025 | $4,112 +0.5% | $276,500 +0.1% |
| 2024 | $4,091 +6.9% | $276,200 +12.1% |
| 2023 | $3,828 +3.6% | $246,300 +5.1% |
| 2022 | $3,694 +18.1% | $234,400 +26.6% |
| 2021 | $3,128 -0.9% | $185,100 -0.4% |
| 2020 | $3,158 +0.2% | $185,900 |
| 2019 | $3,153 -10% | $185,900 -9.6% |
| 2018 | $3,505 | $205,600 |
| 2017 | $3,505 +1.3% | $205,600 +0.9% |
| 2016 | $3,461 +2.1% | $203,700 +2.1% |
| 2015 | $3,391 +3.5% | $199,600 |
| 2014 | $3,275 -0.2% | $199,600 -0.1% |
| 2013 | $3,283 -4.7% | $199,700 |
| 2012 | $3,445 +2.5% | $199,700 -0.7% |
| 2011 | $3,362 -0.8% | $201,100 -5.1% |
| 2010 | $3,390 +5.6% | $211,900 -3.2% |
| 2009 | $3,211 +2.7% | $219,000 |
| 2008 | $3,127 +3.7% | $219,000 +6.3% |
| 2007 | $3,014 +2.7% | $206,000 +10.2% |
| 2006 | $2,936 +7.5% | $186,900 +5.9% |
| 2005 | $2,732 +5.4% | $176,500 +26.1% |
| 2004 | $2,591 +4.8% | $140,000 |
| 2002 | $2,472 +5.1% | $140,000 +10.1% |
| 2001 | $2,353 | $127,200 |
Find assessor info on the county website
Monthly payment
Est. payment
Payment breakdown
Explore the cost of this home by adjusting the details. Changes won't be saved.Climate risks
Neighborhood: 01089
- $296,9002 bd1 ba1.1k sqft282 Morton St, West Springfield, MA 01089Off Market
- $386,5003 bd2 ba1k sqft147 Albert St, West Springfield, MA 01089Off Market

- $346,6003 bd1 ba1.5k sqft60 Bowers St, West Springfield, MA 01089Off Market
- $328,6003 bd1 ba1.1k sqft293 Morton St, West Springfield, MA 01089Off Market

Similar homes
- $323,9003 bd2 ba1.1k sqft87 Roosevelt Ave, Westfield, MA 01085For Sale
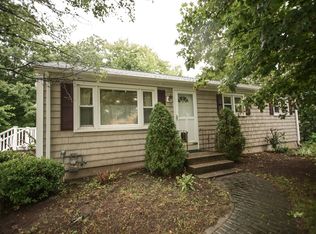 MLS ID #73586969, Christopher Olson, REMAX Connections - Belchertown. MLS PIN
- $349,9003 bd2 ba1k sqft460 Shaker Rd, Westfield, MA 01085For Sale
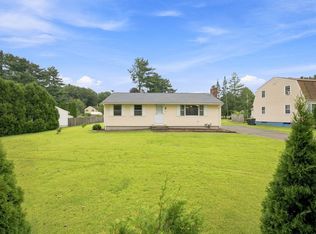 MLS ID #73571936, Carrie A. Blair, Keller Williams Realty. MLS PIN
- $360,0003 bd2 ba1.4k sqft21 Carmel Ln, Feeding Hills, MA 01030For Sale
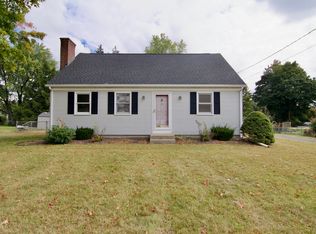 MLS ID #73587556, Nunley Group, Executive Real Estate, Inc.. MLS PIN
- $349,9003 bd1 ba1.2k sqft262 Cooper St, Agawam, MA 01001For Sale
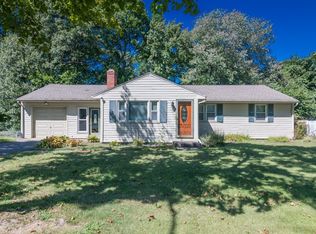 MLS ID #73577998, Nicole Cote, Ayre Real Estate Co, Inc.. MLS PIN
- $309,9003 bd2 ba1.3k sqft3 Middle Drive, Windsor Locks, CT 06096For Sale
 MLS ID #24211548, Lori Gabriel, Coldwell Banker Realty. Smart MLS
