Tenant Occupied. Rent is $850.00 per month. Tenant is current. Ove 62K in recent renovations. See details in photos. 4 Bedroom and 2 Baths. Sold with Tenant in Place. Do NOT disturb tenant. 48 to 72 hour Notice required to schedule showings.
For sale
$84,900
3928 37th Ave N, Birmingham, AL 35217
3beds
1,140sqft
Single Family Residence
Built in 1953
8,712 Square Feet Lot
$-- Zestimate®
$74/sqft
$-- HOA
What's special
- 4 days
- 175
- 18
Likely to sell faster than
Zillow last checked:
Listing updated:
Listed by:
Bryan Welch 205-529-8614,
REALTYNET
Source: GALMLS,MLS#: 21469141
Facts & features
Interior
Bedrooms & bathrooms
- Bedrooms: 3
- Bathrooms: 2
- Full bathrooms: 2
Rooms
- Room types: Bedroom, Bathroom
Bedroom 1
- Level: First
Bedroom 2
- Level: First
Bedroom 3
- Level: First
Bathroom 1
- Level: First
Basement
- Area: 0
Heating
- Central
Cooling
- Central Air
Appliances
- Included: None, Electric Water Heater
- Laundry: Electric Dryer Hookup, Washer Hookup, Main Level, Other, Yes
Features
- Tub/Shower Combo
- Flooring: Vinyl
- Basement: Crawl Space
- Attic: None
- Has fireplace: No
Interior area
- Total interior livable area: 1,140 sqft
- Finished area above ground: 1,140
- Finished area below ground: 0
Video & virtual tour
Property
Parking
- Parking features: Driveway
- Has uncovered spaces: Yes
Features
- Levels: One
- Stories: 1
- Exterior features: None
- Pool features: None
- View description: None
- Waterfront features: No
Lot
- Size: 8,712 Square Feet
Details
- Parcel number: 2300181015018.000
- Special conditions: N/A
Construction
Type & style
- Home type: SingleFamily
- Property subtype: Single Family Residence
Materials
- Wood Siding
Condition
- Fixer
- Year built: 1953
Utilities & green energy
- Water: Public
- Utilities for property: Sewer Connected
Community & HOA
Community
- Subdivision: Tarrant City
Location
- Region: Birmingham
Financial & listing details
- Price per square foot: $74/sqft
- Tax assessed value: $77,000
- Annual tax amount: $1,117
- Price range: $84.9K - $84.9K
- Date on market: 11/1/2026
Estimated market value
Not available
Estimated sales range
Not available
$1,058/mo
Price history
| Date | Event | Price |
|---|---|---|
| 11/1/2026 | Listed for sale | $84,900+78.7%$74/sqft |
Source:  GALMLS #21469141 Report a problem | ||
| 4/17/2026 | Listing removed | $1,000$1/sqft |
Source: Zillow Rentals Report a problem | ||
| 3/31/2026 | Listed for rent | $1,000$1/sqft |
Source: Zillow Rentals Report a problem | ||
| 3/30/2026 | Listing removed | $1,000$1/sqft |
Source: Zillow Rentals Report a problem | ||
| 2/19/2026 | Price change | $1,000-9.1%$1/sqft |
Source: Zillow Rentals Report a problem | ||
| 1/31/2026 | Price change | $1,100-4.3%$1/sqft |
Source: Zillow Rentals Report a problem | ||
| 1/14/2026 | Price change | $1,150-11.5%$1/sqft |
Source: Zillow Rentals Report a problem | ||
| 9/12/2025 | Listed for rent | $1,300+88.4%$1/sqft |
Source: Zillow Rentals Report a problem | ||
| 5/13/2025 | Sold | $47,500-13.6%$42/sqft |
Source: GALMLS #21416599 Report a problem | ||
| 5/5/2025 | Pending sale | $55,000$48/sqft |
Source: GALMLS #21416599 Report a problem | ||
| 4/22/2025 | Listed for sale | $55,000+168.3%$48/sqft |
Source: GALMLS #21416599 Report a problem | ||
| 6/20/2019 | Sold | $20,500+28.1%$18/sqft |
Source: Public Record Report a problem | ||
| 2/9/2019 | Listing removed | $690$1/sqft |
Source: Barrington Real Estate Report a problem | ||
| 9/21/2018 | Listed for rent | $690$1/sqft |
Source: Barrington Real Estate Report a problem | ||
| 4/8/2014 | Listing removed | $690$1/sqft |
Source: Go Section8 Report a problem | ||
| 12/12/2013 | Price change | $690-4.8%$1/sqft |
Source: Barrington Real Estate Report a problem | ||
| 11/8/2013 | Listed for rent | $725$1/sqft |
Source: Go Section8 Report a problem | ||
| 2/6/2013 | Listing removed | $725$1/sqft |
Source: BARRINGTON REAL ESTA Report a problem | ||
| 12/27/2012 | Listed for rent | $725$1/sqft |
Source: BARRINGTON REAL ESTA Report a problem | ||
| 6/23/2009 | Listing removed | $16,000$14/sqft |
Source: foreclosure.com Report a problem | ||
| 4/27/2009 | Listed for sale | $16,000-66.3%$14/sqft |
Source: foreclosure.com Report a problem | ||
| 4/6/2000 | Sold | $47,500$42/sqft |
Source: Public Record Report a problem | ||
Public tax history
| Year | Property taxes | Tax assessment |
|---|---|---|
| 2025 | $1,117 | $15,400 |
| 2024 | $1,117 | $15,400 |
| 2023 | $1,117 +41.5% | $15,400 +41.5% |
| 2022 | $789 -8.9% | $10,880 -8.9% |
| 2021 | $866 +4.6% | $11,940 +4.6% |
| 2020 | $828 -4.4% | $11,420 -4.4% |
| 2019 | $866 +16.6% | $11,940 +16.6% |
| 2018 | $742 | $10,240 |
| 2017 | $742 +5.1% | $10,240 +5.1% |
| 2016 | $706 -4.9% | $9,740 -4.9% |
| 2015 | $742 -6.1% | $10,240 +8% |
| 2014 | $790 | $9,480 |
| 2013 | $790 | $9,480 -16.6% |
| 2012 | $790 +76.3% | $11,370 +76.3% |
| 2007 | $448 +4.9% | $6,450 +4.9% |
| 2006 | $427 +7% | $6,150 +7% |
| 2005 | $400 +4% | $5,750 -47.6% |
| 2004 | $384 +4.3% | $10,980 +4.2% |
| 2003 | $368 +29.3% | $10,540 +157.1% |
| 2002 | $285 | $4,100 |
| 2001 | $285 | $4,100 |
| 2000 | $285 | $4,100 |
Find assessor info on the county website
Monthly payment
Est. payment
Payment breakdown
Explore the cost of this home by adjusting the details. Changes won't be saved.Climate risks
Neighborhood: Inglenook
Nearby schools
Schools provided by the listing agent
- Elementary: Tarrant
- Middle: Tarrant
- High: Tarrant
Source: GALMLS. This data may not be complete. We recommend contacting the local school district to confirm school assignments for this home.
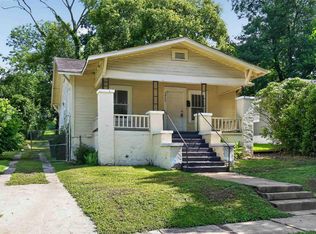

Similar homes
- $89,5003 bd1 ba1k sqft407 S Park Rd SW, Birmingham, AL 35211For Sale

 MLS ID #21469191, Bryan Welch, REALTYNET. GALMLS
- $87,5003 bd2 ba1.4k sqft1153 Bristol St, Birmingham, AL 35217For Sale
 MLS ID #21466775, Bryan Welch, REALTYNET. GALMLS
- $90,0003 bd1 ba1.2k sqftSpectrum, At&t, Birmingham, AL 35214For Sale
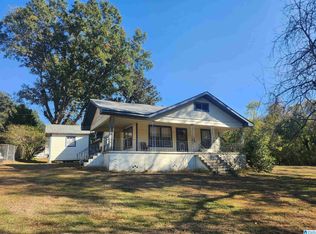 MLS ID #21469069, Jackie Rhodes, Keller Williams. GALMLS
- $84,9993 bd1 ba1.1k sqft7308 4th Ave N, Birmingham, AL 35206For Sale
 MLS ID #21456075, Bryan Welch, REALTYNET. GALMLS
- $85,0003 bd1 ba1.2k sqft8504 3rd Ave N, Birmingham, AL 35206For SaleMLS ID #21457199, John Stanback, Evernest Too. GALMLS
- $99,9003 bd1 ba1.2k sqft2241 1st Pl NW, Birmingham, AL 35215For SaleMLS ID #21469164, Melissa Justice, Alabama Realty Servicing Inc. GALMLS
- $80,0003 bd1 ba1.2k sqft8215 8th Ave S, Birmingham, AL 35206For SaleMLS ID #21457481, Neal Thomas, Minnie Lee Realty. GALMLS
- $59,9003 bd1 ba1k sqft4317 50th Ave N, Birmingham, AL 35217For SaleMLS ID #21457096, Isabella Crandall, Trelora Realty, INC. GALMLS
- $89,0004 bd1 ba1.2k sqft8242 Vassar Ave, Birmingham, AL 35206For SaleMLS ID #21461721, Jordan Holt, Signal Property Services. GALMLS
- $89,9003 bd2 ba1.3k sqft1717 Saint Charles Ave SW, Birmingham, AL 35211For SaleMLS ID #21450167, Kimmie Mack Womack, Keller Williams Realty Vestavia. GALMLS
- $89,9002 bd1 ba1.1k sqft525 62nd St S, Birmingham, AL 35212For SaleMLS ID #21458495, Margie Beth Shaw, Keller Williams Realty Vestavia. GALMLS
- $79,9003 bd1 ba1k sqft800 Rutledge Dr, Midfield, AL 35228For SaleMLS ID #21469147, Bryan Welch, REALTYNET. GALMLS
- $99,9003 bd1 ba960 sqft2724 Lee Ave SW, Birmingham, AL 35211For SaleMLS ID #21469093, Bryan Welch, REALTYNET. GALMLS
- $84,0003 bd1 ba1k sqft1705 2nd Ct W, Birmingham, AL 35208For SaleMLS ID #21456156, Les Jenkins, Keller Williams Realty Hoover. GALMLS
- $79,9004 bd2 ba1.6k sqft1813 28th St, Birmingham, AL 35218For SaleMLS ID #21447968, Mason Sanders, Keller Williams Realty Hoover. GALMLS
- $90,0003 bd2 ba1.1k sqft4619 Terrace #Q, Birmingham, AL 35208For SaleMLS ID #21462625, Luke Goubeaud, RealtySouth-Inverness Office. GALMLS
- $83,5002 bd1 ba959 sqft47 15th Ave W, Birmingham, AL 35204For SaleMLS ID #21442404, Karen Paulovich, Sweet HOMElife Real Estate. GALMLS
- $62,0003 bd1 ba997 sqft8229 9th Ave S, Birmingham, AL 35206For SaleMLS ID #21461413, Gusty Gulas, eXp Realty, LLC Central. GALMLS
- $85,0002 bd1 ba930 sqft1408 35th St, Birmingham, AL 35218For SaleMLS ID #21467132, Trae King, EXIT MelRose Realty. GALMLS
