$524,800
4 bd|2 ba|2.6k sqft
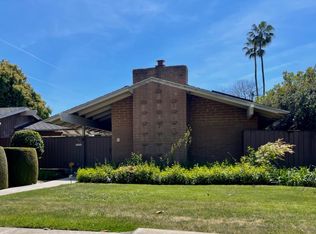
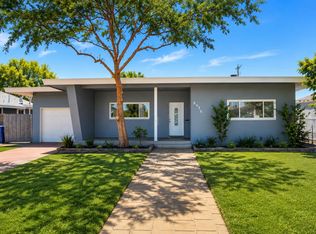
711 W Rialto Ave, Fresno, CA 93705
Off Market
Zillow last checked:
Listing updated:
Duc Pham 01905915 408-357-0889,
Upbeat Realty 408-357-0889,
Rosie Hong Pham 02216970 408-666-5825,
Wonder Rates
$468,400
$445,000 - $492,000
$2,447/mo
| Date | Event | Price |
|---|---|---|
| 6/8/2026 | Listed for sale | $475,000+8%$265/sqft |
Source: | ||
| 8/8/2025 | Listing removed | $2,600$1/sqft |
Source: Zillow Rentals Report a problem | ||
| 7/24/2025 | Listed for rent | $2,600$1/sqft |
Source: Zillow Rentals Report a problem | ||
| 4/22/2024 | Sold | $440,000+0%$246/sqft |
Source: Fresno MLS #607648 Report a problem | ||
| 3/25/2024 | Pending sale | $439,900$246/sqft |
Source: Fresno MLS #607648 Report a problem | ||
| 3/9/2024 | Price change | $439,900-2.2%$246/sqft |
Source: Fresno MLS #607648 Report a problem | ||
| 2/2/2024 | Listed for sale | $449,900+26.4%$251/sqft |
Source: Fresno MLS #607648 Report a problem | ||
| 9/28/2023 | Sold | $356,000-1%$199/sqft |
Source: Fresno MLS #597329 Report a problem | ||
| 9/23/2023 | Pending sale | $359,500$201/sqft |
Source: Fresno MLS #597329 Report a problem | ||
| 9/19/2023 | Price change | $359,500-5.3%$201/sqft |
Source: Fresno MLS #597329 Report a problem | ||
| 8/26/2023 | Listed for sale | $379,500+35.5%$212/sqft |
Source: Fresno MLS #597329 Report a problem | ||
| 10/10/2007 | Sold | $280,000+154.5%$156/sqft |
Source: Public Record Report a problem | ||
| 6/12/1998 | Sold | $110,000$61/sqft |
Source: Public Record Report a problem | ||
| Year | Property taxes | Tax assessment |
|---|---|---|
| 2025 | $5,822 +28.4% | $448,800 +26.1% |
| 2024 | $4,536 +0.7% | $356,000 +0.7% |
| 2023 | $4,506 +1.4% | $353,491 +2% |
| 2022 | $4,444 +18.5% | $346,561 +17.6% |
| 2021 | $3,751 +11.2% | $294,600 +12% |
| 2020 | $3,372 +7.5% | $263,100 +5.5% |
| 2019 | $3,136 +2.2% | $249,400 +2% |
| 2018 | $3,069 +6.6% | $244,600 +7% |
| 2017 | $2,878 +6.4% | $228,700 +5% |
| 2016 | $2,705 +10.9% | $217,900 +10.9% |
| 2015 | $2,440 +6.7% | $196,400 +6.7% |
| 2014 | $2,287 | $184,000 +15.9% |
| 2013 | -- | $158,700 +10% |
| 2012 | -- | $144,300 -5.1% |
| 2011 | -- | $152,000 -15% |
| 2010 | -- | $178,800 |
| 2009 | -- | $178,800 -29.6% |
| 2008 | -- | $254,000 +93.8% |
| 2007 | -- | $131,091 +2% |
| 2006 | -- | $128,521 +2% |
| 2005 | -- | $126,002 +2% |
| 2004 | -- | $123,533 +1.9% |
| 2003 | -- | $121,270 +2% |
| 2002 | -- | $118,893 +2% |
| 2001 | $1,418 | $116,563 |
Find assessor info on the county website
Source: MLSListings Inc. This data may not be complete. We recommend contacting the local school district to confirm school assignments for this home.
A local agent can set up tours, give advice and negotiate with sellers.
A local lender can help you make sure your offer is ready when you are.
Local buyer's agents are ready to help